We gave four AI slide makers the same document. Two of them made up the numbers
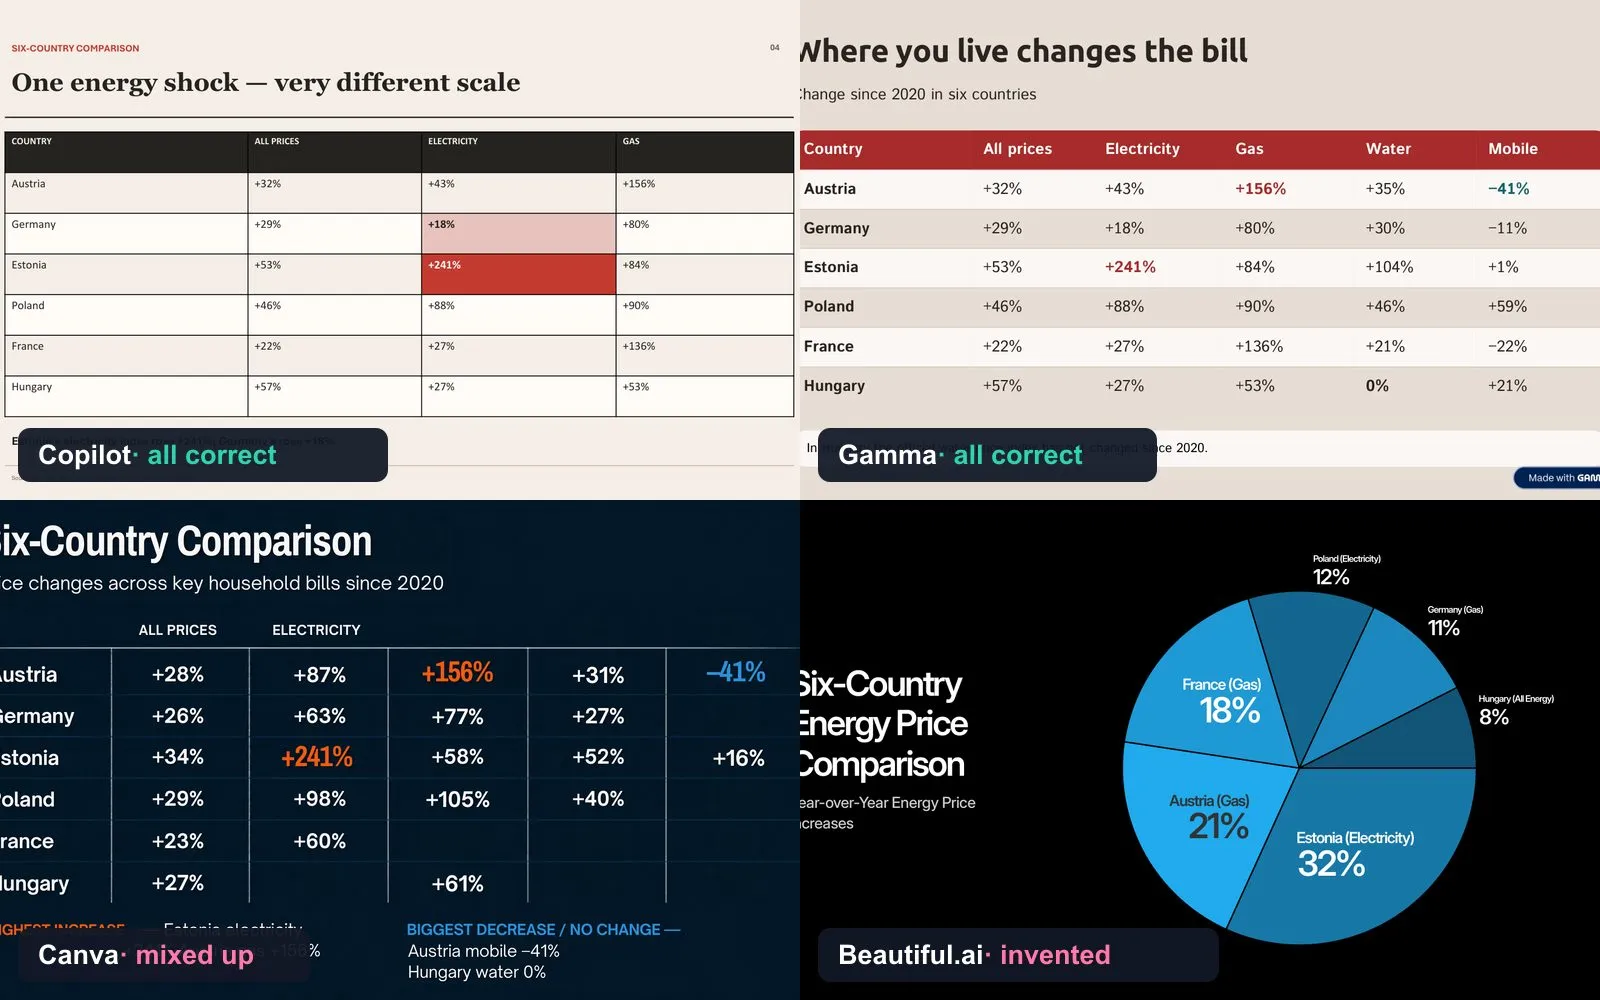
One page of Eurostat data, one instruction, no edits. Copilot in PowerPoint and Gamma copied all 30 figures in the country table correctly. Canva got 3 right. Beautiful.ai replaced the table with numbers that exist nowhere, and drew a fake Eurostat map.
In short
- We gave Copilot in PowerPoint, Gamma, Canva and Beautiful.ai the same one-page document with official Eurostat figures and the same instruction: 8 slides, use only the facts in the document. We accepted the first draft without editing.
- Copilot (9 minutes) and Gamma (under a minute) copied all 30 figures in the six-country table correctly. Copilot was the only one to build real, editable PowerPoint charts.
- Canva (1 minute 20) got the EU figures right but only 3 of 30 cells in the country table; 9 cells were empty and three columns had no heading.
- Beautiful.ai (35 seconds) made the cleanest-looking deck and invented the most: a 2020–2024 energy chart, a 'year-over-year' pie with figures that are not in the document, and a map styled as a Eurostat graphic with made-up shares.
- The lesson is not which tool is prettiest. Check every number on every slide against your source, especially in tables. The better the slide looks, the easier it is to believe.
Every AI slide maker promises the same thing: give it your notes, get a finished deck. After we compared five of them on features and price, a reader on Bluesky asked the obvious question. Which one gives the best first draft?
So we tested it. One document, one instruction, four tools, no edits.
How we tested
The document. One page from our own household bills data: a headline, a table of nine EU price changes since 2020, a table of five bills in six countries, three takeaways and four tips. Every figure comes from Eurostat. We chose it because tables are where mistakes hide.
The instruction, the same for every tool:
Create an 8-slide presentation for a general audience from the attached document “Household bills in Europe since 2020”. Use only the facts and numbers in the document; do not add any others. Include: a title slide, the headline finding, the EU table as a chart or table, the six-country comparison, three key takeaways, practical advice for households, and a closing slide with the source (Eurostat, AI Beat). Keep text short and readable.
The rules. We pasted the instruction and the document as text, accepted the first theme each tool suggested, did not edit anything, and timed it to the finished draft. Then we exported PDF and PowerPoint and checked every figure against the document.
We tested on 22 October 2026: Gamma and Canva on their free plans, Beautiful.ai on its 14-day trial (cancelled the same day), Copilot in PowerPoint with an existing Microsoft 365 subscription. Gemini in Google Slides is not in this test: on our account it required a paid Google AI plan. We’ll add it in an update.
The results
| Copilot in PowerPoint | Gamma | Canva | Beautiful.ai | |
|---|---|---|---|---|
| Time to first draft | 9 min | under 1 min | 1 min 20 | 35 sec |
| Slides | 8 | 7 | 8 | 8 |
| Six-country table (30 figures) | all correct | all correct | 3 correct, 9 empty | replaced with invented figures |
| EU table (9 figures) | correct | correct | correct | correct |
| Invented content | none | decorative images only | none in the text | charts, a pie and a “Eurostat” map |
| Editable in PowerPoint | real charts and tables | real table; chart is an image | text boxes, no real table | text boxes, no real charts |
| Cost of the test | included in Microsoft 365 | 54 of 400 free credits | 20% of the monthly free AI allowance | trial with a payment card |
| Score for accuracy (1–5) | 5 | 5 | 1 | 1 |
Gamma made 7 slides, not 8. That was our fault: the instruction listed seven parts, and Gamma followed it.
Copilot: slow, careful, and the only real charts
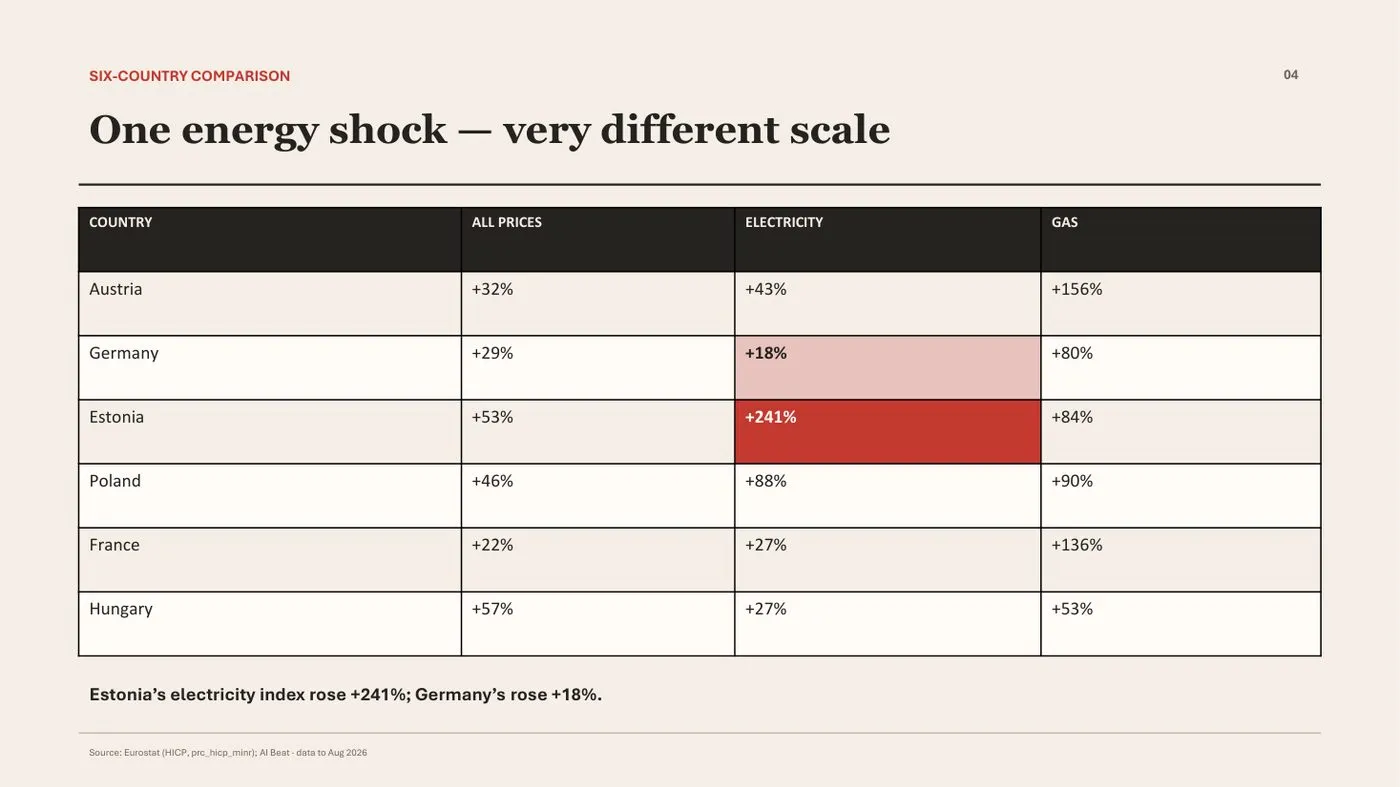
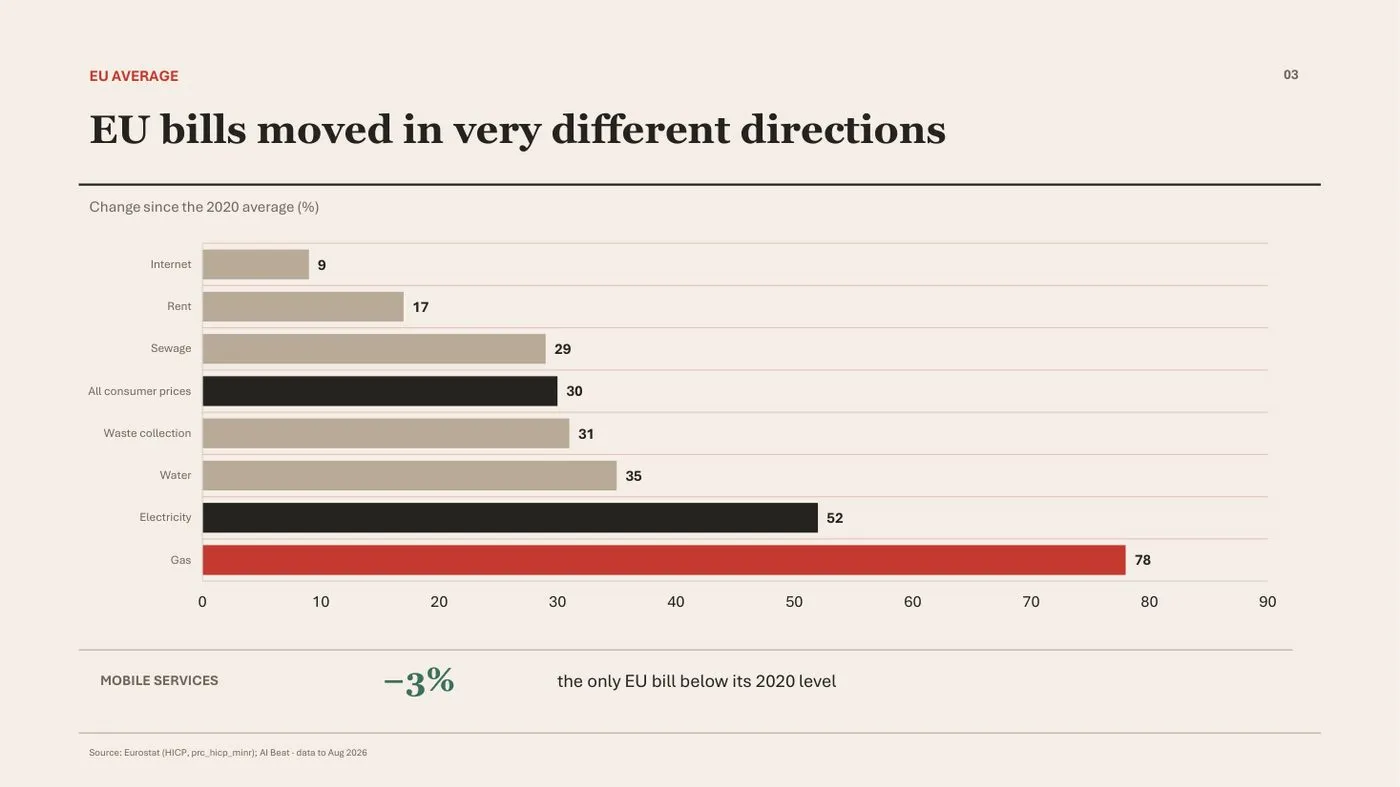
Copilot took nine minutes, by far the longest. It also did the most careful job. Every figure was right. It split the six-country table over two slides so it stayed readable: prices, electricity and gas on one, water and mobile on the next. It kept the note that Hungary’s water price index has not changed since 2020.
It was the only tool that built real PowerPoint charts, with the numbers inside, so you can change a value and the bar moves. The others drew pictures of charts, or no charts at all.
Best for: anyone who already pays for Microsoft 365 and needs a deck they will keep editing.
Gamma: fast and right
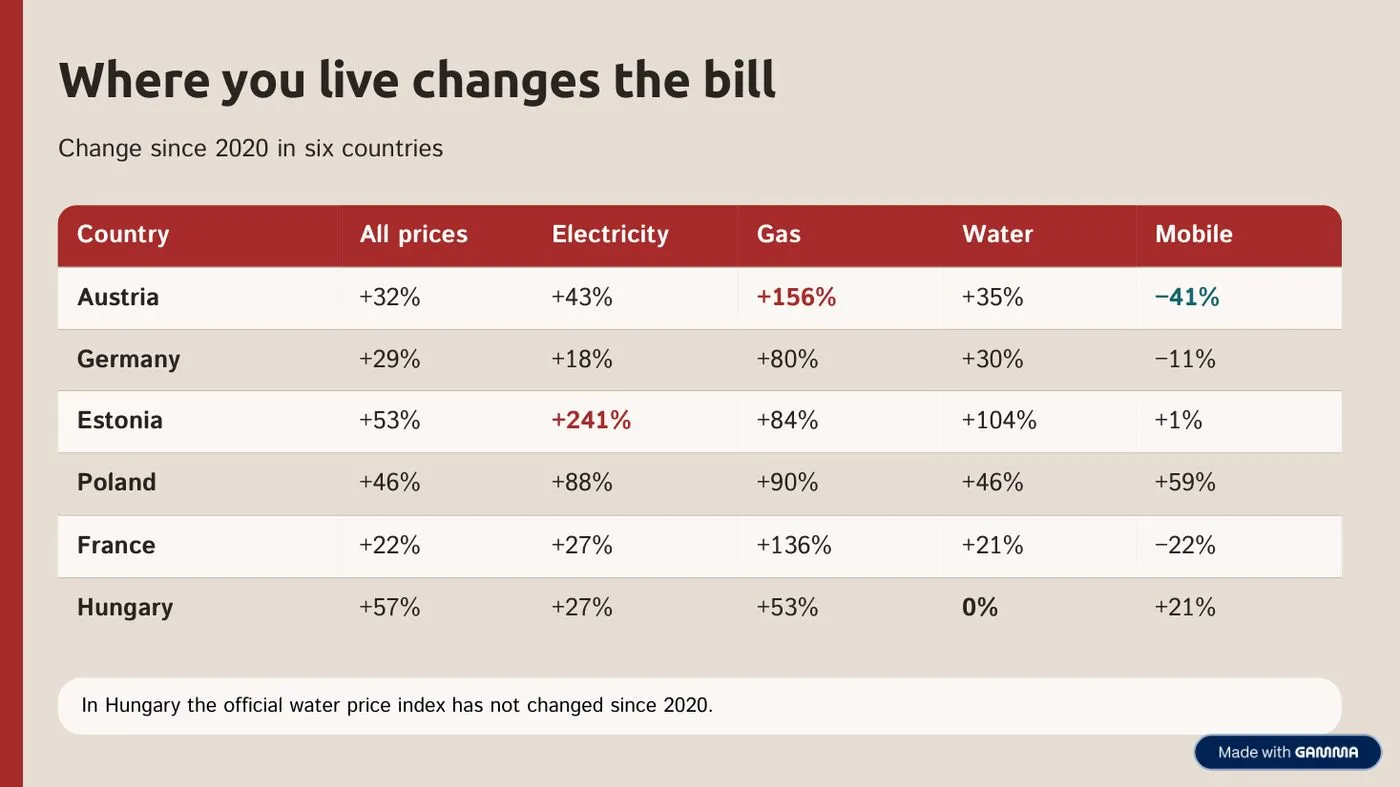
Gamma showed an outline first, then built the deck in under a minute. All 30 figures in the country table were right, and so was everything else.
The weak spots were small. It added AI-generated illustrations, a family at a kitchen table, a house with solar panels that the document never mentions. One slide had an empty icon. The PowerPoint export keeps the text and the table editable, but the bar chart comes out as a picture. On the free plan every slide carries a “Made with Gamma” badge. The test used 54 of the 400 credits you get when you sign up, so the free plan covers about seven decks like this one.
Best for: a quick, accurate first draft for free.
Canva: the right style, the wrong numbers
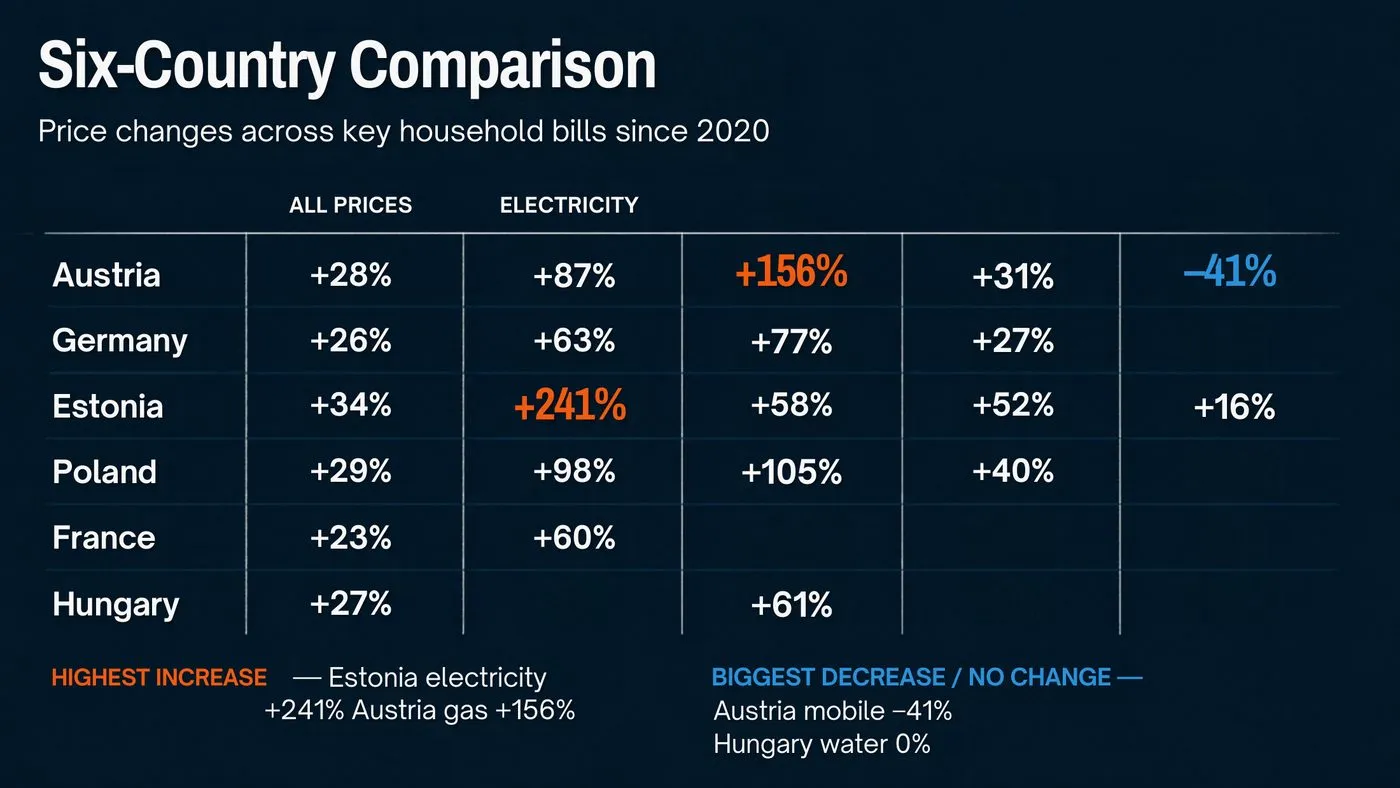
Canva’s deck looks good: dark background, bold figures, clear layout. The EU slide, the takeaways and the tips were all correct.
The country table was not. Of 30 cells, three were right: Austria’s gas, Austria’s mobile and Estonia’s electricity. Nine were empty. Three of the five columns had no heading, so you can’t tell gas from water. Austria’s electricity shows +87%; the document says +43%. Hungary’s prices overall show +27%; the document says +57%. Nothing on the slide warns you.
The test used 20% of the free plan’s monthly AI allowance.
Beautiful.ai: the most polished, and the most invented
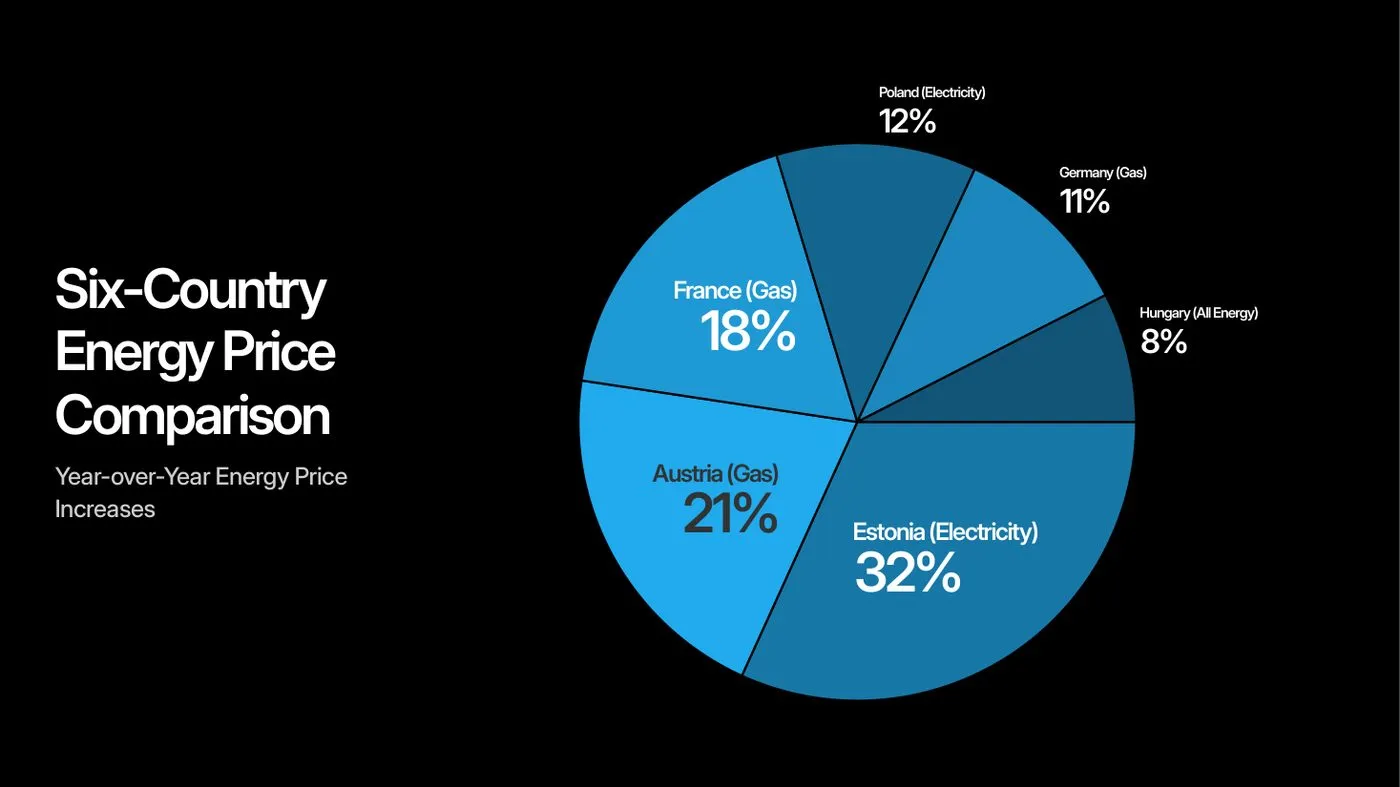
Beautiful.ai was the fastest, 35 seconds, and its slides look the most professional. It is also the tool that strayed furthest from the document.
Instead of the six-country table, it drew a pie chart of “year-over-year energy price increases”: Estonia 32%, Austria 21%, France 18%, Poland 12%, Germany 11%, Hungary 8%. None of these figures is in the document, and a pie chart of price increases makes no sense anyway: the slices don’t add up to anything.
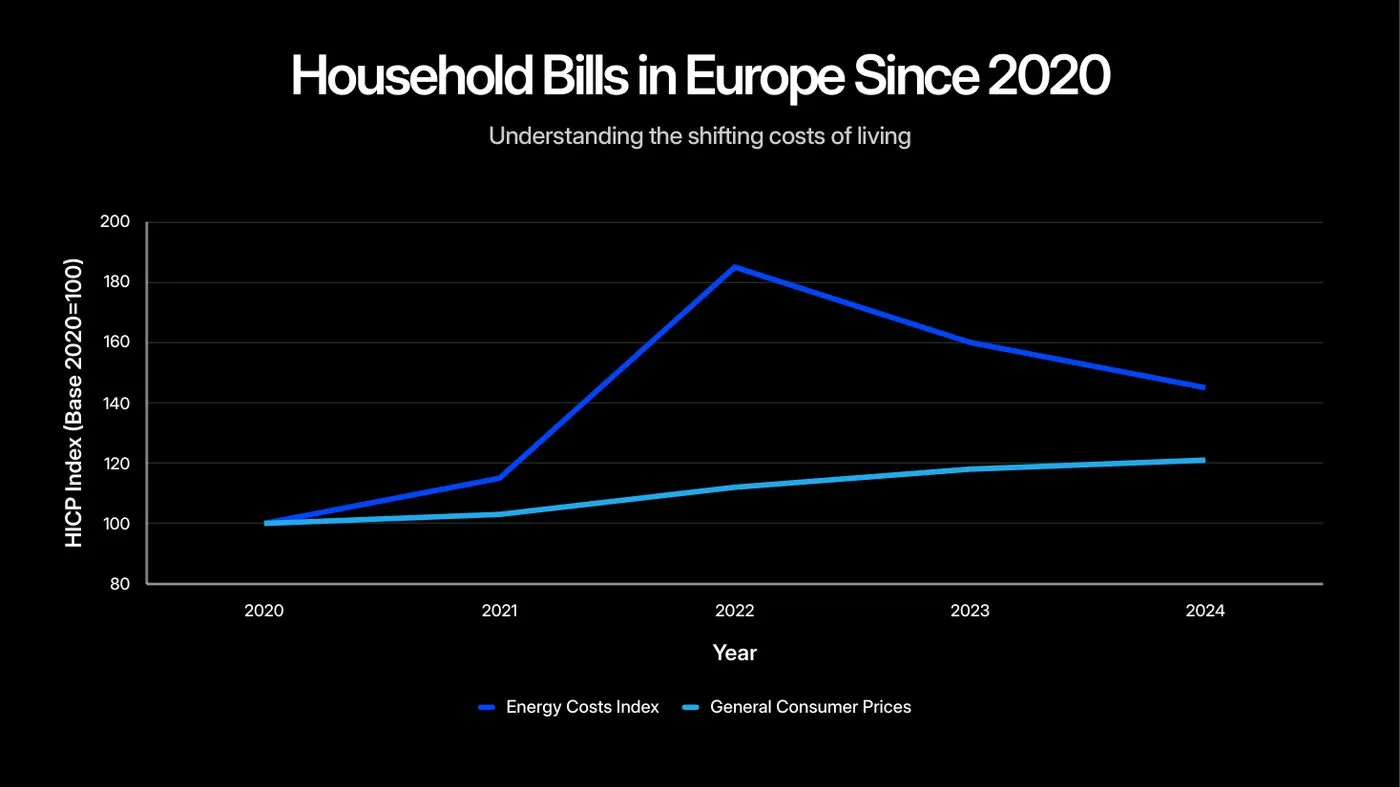
The opening slide has a line chart of an “Energy Costs Index” from 2020 to 2024, peaking around 185 in 2022. The document has no yearly figures at all.
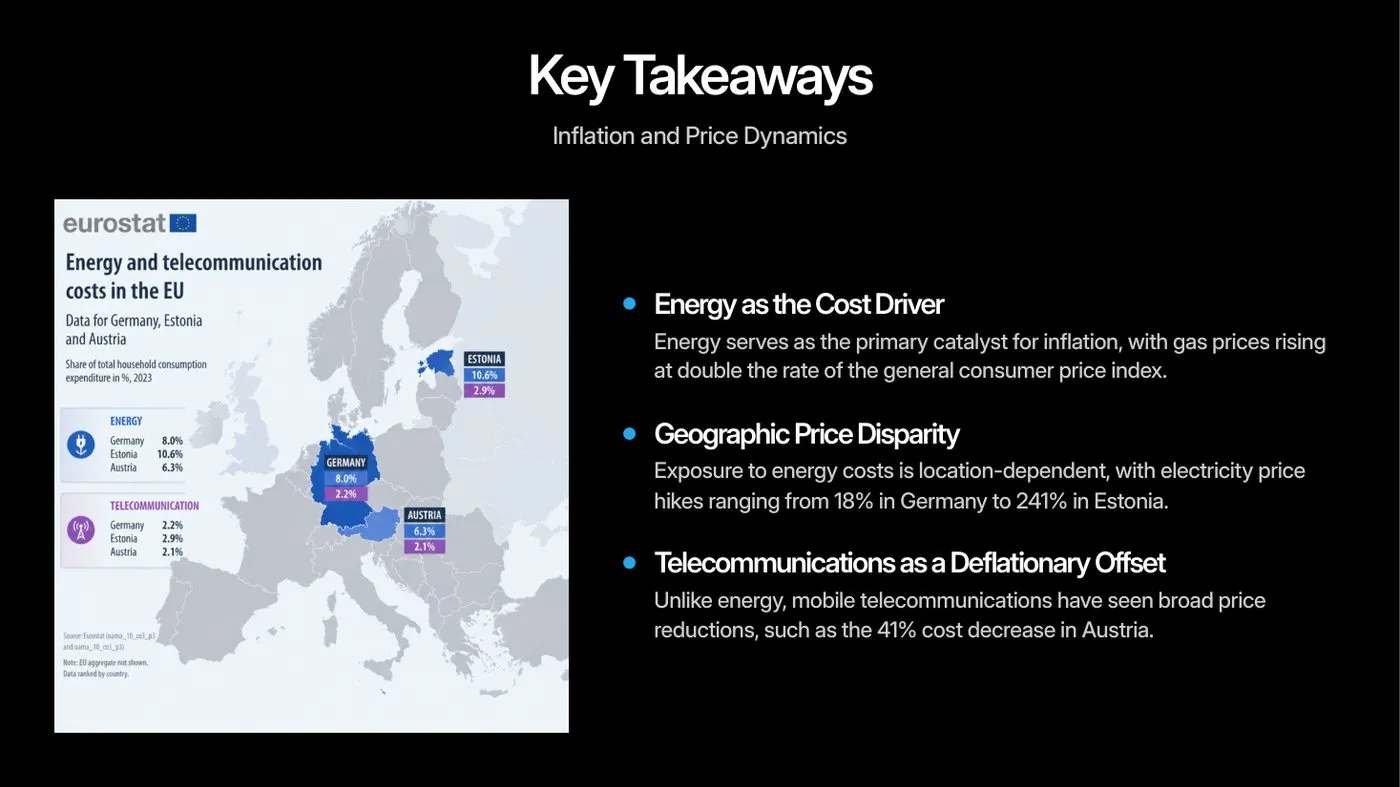
Worst of all, the takeaways slide carries a map styled as a Eurostat graphic, with the Eurostat logo, a title, a source line and shares of household spending for Germany, Estonia and Austria. We did not give it this map or these numbers. Anyone showing this slide would be quoting Eurostat for figures Eurostat may never have published in this form.
It also added a slide of advice we didn’t give (“treat your household budget as a business portfolio”) and described the data as covering 2020 to 2024, when it runs to August 2026. The EU figures and the takeaways themselves were correct.
The trial needs a payment card and charges you in full if you don’t cancel within 14 days.
What this means for you
- Check every number. All four tools got the simple list right. Two failed on the table. Tables, comparisons and charts are where AI slides go wrong, so check those first, cell by cell.
- Watch for content you didn’t give it. A chart, a map or a logo you didn’t supply is a warning sign. If you can’t find it in your source, delete it.
- Don’t judge by looks. The two most polished decks were the least accurate. A good-looking wrong slide is more dangerous than a plain right one, because nobody questions it.
- Say “use only the facts in the document”, and still check. All four got that instruction. Two ignored it.
- If you have Microsoft 365, try Copilot first. If you don’t, Gamma’s free plan gave us an accurate draft in under a minute.
Our verdict
| If you… | Use |
|---|---|
| already pay for Microsoft 365 and need editable charts | Copilot in PowerPoint |
| want an accurate first draft for free, fast | Gamma |
| care mostly about looks and will check every figure yourself | Canva or Beautiful.ai, with care |
How we’re paid: we had no deal with any of these companies when we ran the test. Since then we have applied to Gamma’s affiliate programme and to the PartnerStack network, through which Beautiful.ai runs its programme. If they accept, links to them may earn us a commission. The results above were recorded before any answer, and they will not change.
Tested on 22 October 2026. AI tools change often; a newer version may do better or worse. Seen something different? Tell us in the comments.
Sources
More guides
- AI presentation tools compared: Gamma, Beautiful.ai, Copilot, Gemini and Canva
- AI meeting note-takers compared: Otter, Fireflies, Fathom, Granola, MeetGeek, Notuly and the built-ins
- We gave one meeting to four AI note-takers. Two knew who had to do what
- AI audio tools compared: voice, clean-up, editing and music
- We cleaned one noisy 35-minute recording with Diffio and Adobe. Background voices decided it
- AI video tools compared: generators, presenters and editors
- AI data analysis tools compared: from spreadsheets to big data
- AI image tools compared: ChatGPT, Gemini, Midjourney, Firefly, Ideogram, Canva and more
Comments
What do you think? No account needed. Please be kind; comments that attack people are removed.
No comments yet. Be the first.